


Registration Frequencies
Weekly updated frequencies of observation starts at registration by medication are shown.
Fig 1) Patient numbers by biologic treatment at inclusion
Last update: 16. April| total n= 25,182
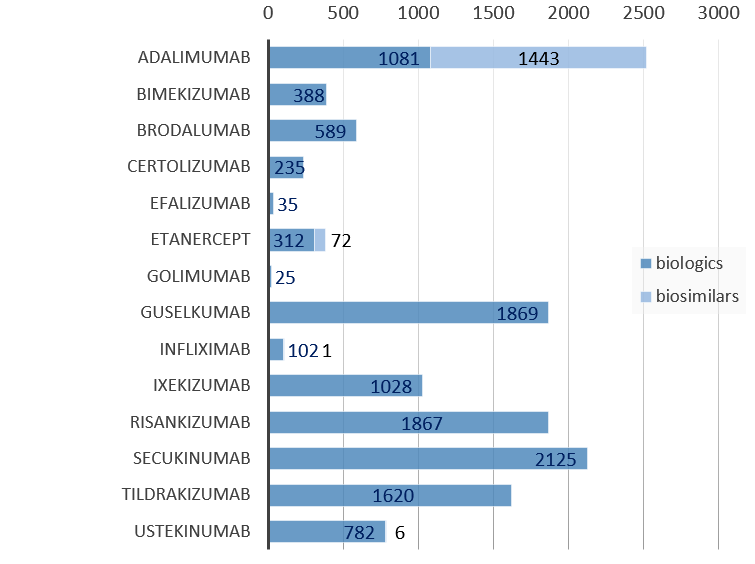
Fig 2) PsoBest registry: patient numbers by non-biologic treatment at inclusion
Last update: 16. April| total n= 25,182
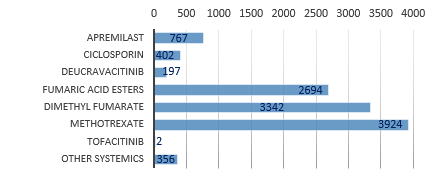
Show table for Fig. 1/2Hide table
| Inclusion Treatment | Patient Number | of that with similar agents (e.g. Biosimilars) |
|---|---|---|
| Adalimumab | 1079 | 1430 |
| Bimekizumab | 379 | 0 |
| Brodalumab | 587 | 0 |
| Certolizumab | 233 | 0 |
| Efalizumab | 35 | 0 |
| Etanercept | 312 | 72 |
| Golimumab | 25 | 0 |
| Guselkumab | 1856 | 0 |
| Infliximab | 102 | 1 |
| Ixekizumab | 1019 | 0 |
| Risankizumab | 1842 | 0 |
| Secukinumab | 2116 | 0 |
| Tildrakizumab | 1595 | 0 |
| Ustekinumab | 781 | 5 |
| Apremilast | 770 | 0 |
| Ciclosporin | 402 | 0 |
| Deucravacitinib | 203 | 0 |
| Fumaric acid esters | 2694 | 0 |
| Dimethyl fumarate | 3356 | 0 |
| Methotrexate | 3923 | 0 |
| Tofacitinib | 2 | 0 |
| Upadacitinib | 7 | 0 |
| other systemics | 356 | 0 |
Fig. 3) Rate of patients by medication class at inclusion
Last update: 16. April| total n= 25,182
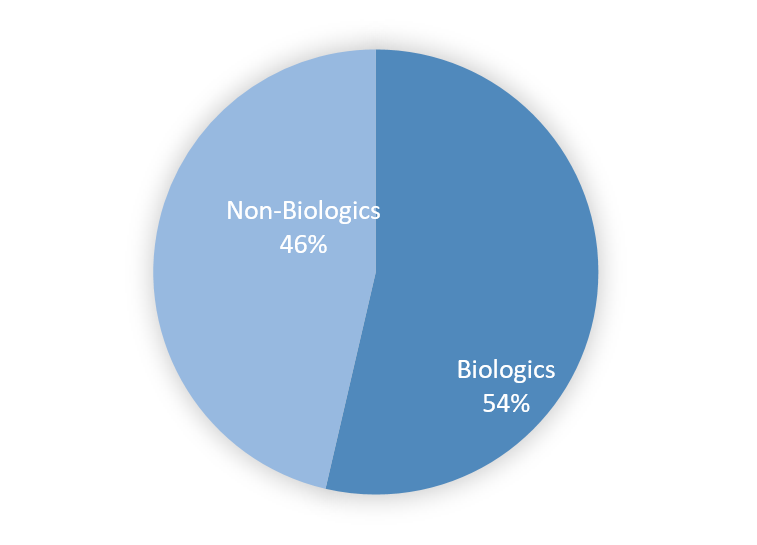
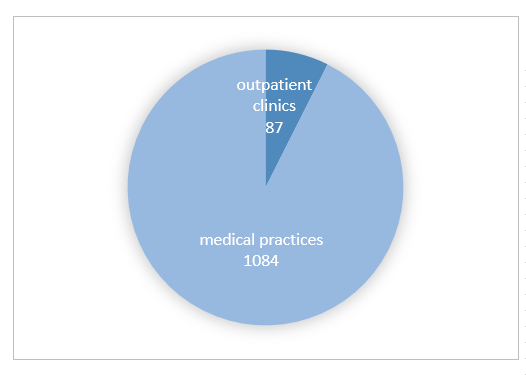
Fig. 4) Rate of patients by type of registry site
Last update: 16. April| total n= 25,182
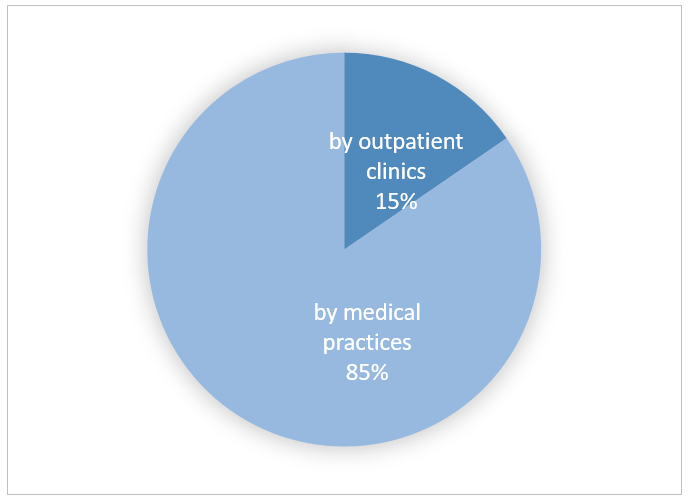
Fig. 5) Registered PsoBest centers
Last update: 16. April| n= 1,191| updated monthly
Current Registration Frequencies

Registries
PsoBest is indexed in the following registries:[br]

 [br][br]…part of Psonet (EU)
![]()
![]()

(German Healthcare Services Research Database)
Cooperations
 BVDD – Association of German Dermatologists
 CVderm – German Center for Health Services Research in Dermatology
 DDG – German Society of Dermatology
 European Network of Centres for Pharmacoepidemiology and Pharmacovigilance (ENCePP®)
 German Network Healthcare Services Research
 IVDP – Institute for Health Services Research in Dermatology and Nursing
 PsoNet – Regional Psoriasis Networks in Germany
 Psonet (EU) – network of EU registries of patients suffering from psoriasis or psoriatic arthritis, being treated by systemic agents